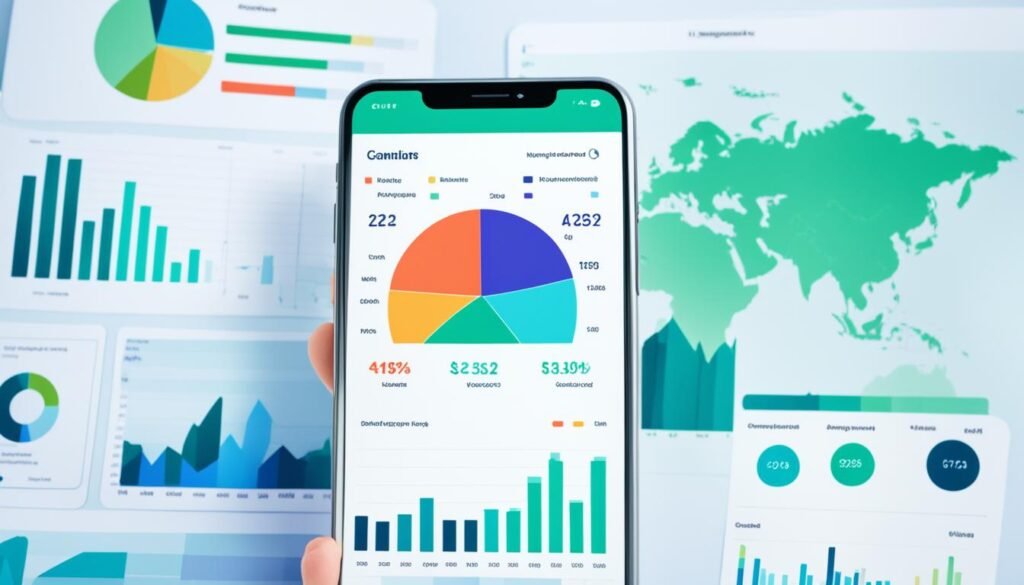
A Custom Accounting Dashboard is a crucial tool for businesses. It helps make finances more straightforward to understand and manage. It uses advanced reports and real-time data to track spending, watch income, and check essential performance numbers.
This dashboard is made to fit different business needs. It combines all financial information in one place, helping users make better decisions and manage money more effectively.
It’s great for tracking expenses and meeting business goals so businesses can handle their money with ease and confidence.
A Financial Dashboard is critical for businesses. It makes tracking important financial information easy and brings together data from many sources into one spot. This helps companies see how they’re doing and make intelligent choices for growth.
A Financial Dashboard gives a full view of financial data. It combines income, costs, and cash flow in one place, making it easy for people to quickly see the company’s financial situation.
Using a Financial Dashboard has big perks. The main benefits are:
These points show how vital a Financial Dashboard is for today’s businesses. It helps them work their best.
A custom accounting dashboard has many features to help with financial management. These features help businesses understand their finances, which in turn helps them make better decisions.
Real-time updates are key to getting the latest financial data. This lets businesses quickly react to financial changes and helps avoid using old information that could lead to bad decisions.
With real-time updates, companies can manage their money better. They can also grab new opportunities fast.
Data visualization turns hard financial info into something easy to get. Using charts, graphs, and dashboards makes it simple to see important details. This makes it easier to understand financial trends and issues.
It also helps teams talk about financial performance better. They can spot trends and problems quickly.
For companies working around the world, managing different currencies is a must. This feature lets users handle money in many currencies easily. It makes financial reports more accurate.
With multi-currency support, businesses can better manage international finance and make smart decisions regardless of their location.
A Custom Accounting Dashboard makes Financial Reporting and analysis easy for businesses. It focuses on Key Performance Indicators (KPIs), which help track important business aspects like revenue and expenses and give insights into the company’s health.
KPIs are like guides for reaching business goals. With a Custom Accounting Dashboard, companies can see and track these KPIs. This helps in making better decisions. Important KPIs include:
Using the dashboard to find these KPIs makes Business Analysis better. It helps companies stay competitive.
Switching to a Custom Accounting Dashboard makes reporting easier. It brings together financial data from different sources, reducing mistakes and saving time.
Automating these tasks lets finance teams focus on deeper analysis, which improves reporting accuracy and allows teams to better predict revenue and expenses.
Tracking expenses is critical to sound money management. It fits nicely into a Custom Accounting Dashboard. This way, businesses can monitor their spending and stick to their budgets. It makes everyone accountable and transparent, which is good for the company’s financial health.
There are smart ways to track expenses with dashboards. Here are some top tips:
Linking expense tracking with budgeting tools helps with money management. This setup offers:

A customizable interface changes how users use a Custom Accounting Dashboard. It lets organizations make experiences that fit different needs. This way, every user gets value from the insights given. It makes users feel like they own the dashboard, making them more engaged.
People in different roles need different metrics and ways to see data. A customizable interface allows users to pick what information is most important to them. This makes users happier and helps them make better decisions, leading to more work done.
Each department has its own goals, and tailored views can really help with this. For example, finance teams might look at cash flow, while marketing looks at campaign results. This way, organizations can give insights that help each department, improving things overall.
Accounting analytics is key for growing a business. It provides insights from financial data. By examining important metrics, companies can see trends that help them make decisions and plans.
Using a custom dashboard with key performance indicators (KPIs) helps businesses check how well they work. These metrics show the financial health and where to get better. Companies can look at:
By watching these metrics, companies can stay quick and make smart choices. These choices help meet goals and grow the business.
Predictive analytics looks at past data to guess future trends. This helps businesses:
Using predictive analytics, companies can plan ahead. They don’t just react to now, they shape their future.

In today’s fast-changing business world, strong forecasting tools are key to better financial planning. These tools help businesses see what their future financials might look like, which makes for smarter decisions.
Getting financial forecasts right is super important for staying ahead. It helps predict costs and earnings so companies can better use their resources. This helps make intelligent choices for the future, keeping the company stable and growing.
Good forecasting changes how businesses plan. With the right tools, companies can see what the market might do next. This lets leaders make smart moves early, keeping them strong in a changing market. The main benefits are:
Adding a Custom Accounting Dashboard to your current software is key to better financial views. It ensures data from different systems work together smoothly, allowing users to see and understand their money from one place.
This makes financial data more reliable and accurate. It helps businesses make smart choices with a full view of their finances.
Seamless integration brings many benefits. It reduces manual data entry, lowering the chance of mistakes. It also improves workflow, saving time and effort.
With up-to-date financial info, companies can quickly adapt to market changes. They can make smart moves fast.
Many top accounting software works well with Custom Accounting Dashboards. QuickBooks, Xero, and Sage are some examples. They share info well with the dashboard.
This means businesses can track their finances better. They also get insights that help them grow and succeed.